Wandb Your machine learning project.
Wandb Tool for visualizing and tracking your machine learning experiments better than tensorboard.
Have you ever worked on large Machine learning projects or research where you have to manage many experimentations ? often during large projects or experiments you have to log every nits and bits of your Machine Learning training. Some of us might already be there. Recently I was also working on large Machine learning Projects and it was very hard for me to track every experiments logs, visualization, experiments. There were lots of them and It would take lots of time to prepare presentation's of my experiments results to my peers and that's when I learned about wandb.
Wandb is API created by Weights & Biases to collect, manage and visualize all your Machine learning experiments all at one place. Ohh, wait you must be wandering that tensorboard can also do these things right ?
Well, there are lots of things which makes wandb a straight winner.
- Visually aesthetics UI.
- More manageable and customizable visualization and experiment tracking.
- Super easy to use API.
- Analyze system usage metrics alongside runs.
- Collaborate with team members
- Run parameter sweeps
- Keep records of experiments available forever
I think the last point in above list is super cool, which is not feasible to do with tensorboard i.e You have to write huge amount of code by yourself to log these system wide metrics into tensorboard, but with wandb you can do this with just one line of code. and
Lets Dive into wandb API.
Installation
Installing wandb is very easy, just run below command in terminal and you are good to go.
pip install wandb

pip install wandb --upgrade
One thing I noticed during installing wandb is that, if we run only pip install wandb it will sometimes only install wrapper class of wandb. So, upgrading wandb library after installing it , worked for me.
Integration with your python code
You can use wandb with any deeplearning framework, either it is pytorch or Tensorflow.But, first you need to have account on Weights & Biases. After you create account on Weights & Biases , you can get your wandb api keys from setting. After you get your keys, you just need to write couple of code to integrate your deeplearning system with wandb logger.
Login
First you need to login into your wandb using wandb API KEYS. you can login programetically or from terminal, but login using terminal is advised.
# This is secret and shouldn't be checked into version control
export WANDB_API_KEY=$YOUR_API_KEY

wandb login
To Programatically login you can use following code:
WANDB_API_KEYS = "<your api keys here>"

import wandb

wandb.login(WANDB_API_KEYS) # if you don't have $WANDB_API_KEYS in your env variable (Not Advised)

wandb.login() # if $WANDB_API_KEYS is already been set.
Initializing wandb ( wandb.init )
Below you will see simple wandb integration examples with keras.
# initialize wandb with your project name and optionally with configutations.
wandb.init(project='demo-keras-integration', name = 'first_run'
           config={
              "learning_rate": 0.005,
              "epochs": 25,
              "batch_size": 64,
              "loss_function": "sparse_categorical_crossentropy",
              "architecture": "CNN",
              "dataset": "CIFAR-10",
           }, anonymous='never')
config = wandb.config

# Initialize model like you usually do.
tf.keras.backend.clear_session()
model = Model()
model.summary()

# compile model like you usually do.
# notice use of config.
optimizer = tf.keras.optimizers.Adam(config.learning_rate)
model.compile(optimizer, config.loss_function, metrics=['acc'])
project is name of your project and your project might have different run, so name parameter will distinguish one run from other.
If you run above code and get back to your wandb dashboard it will new project called demo-keras-integration and with first_run in it.
Above init configuration will create new run everytime you call wandb.init But sometimes that not what you want, If your training is preemptible and might takes days or months to complete then you can resume from previous logged metrics by providing resume = True parameter to wandb.init and you will also need to set unique id, to distinguish one run from another. Below code will resume your logs with current run in your wandb dashboard even after you run init multiple times.
wandb.init(project='demo-keras-integration', name = 'first_run', resume= True,
            id = 'my_first_run'
           config={
              "learning_rate": 0.005,
              "epochs": 25,
              "batch_size": 64,
              "loss_function": "sparse_categorical_crossentropy",
              "architecture": "CNN",
              "dataset": "CIFAR-10",
           }, anonymous='never')
Train with Wandb callback
wandb made easy to log your model metrics into your project space by providing various callback function to log your metrics directly into wandb dashboard, without writing extra code.
from wandb.keras import WandbCallback

# train with our favorite model.fit
# notice WandbCallback used as a regular callback
# notice the use of config
_ = model.fit(x_train, y_train,
          epochs=config.epochs,
          batch_size=config.batch_size,
          validation_data=(x_test, y_test),
          callbacks=[WandbCallback()])
If you are working on images and need a way to log your correctly classified and misclassified sample images, you can also do so using wandb. Below you will see the examples of it.
# in order to get prediction on small subset of images.
val_images, val_labels = x_test[:32], y_test[:32]

# train with our favorite model.fit
# notice WandbCallback used as a regular callback
# notice that we are passing in some arguments as well
# notice the use of config
_ = model.fit(x_train, y_train,
          epochs=config.epochs,
          batch_size=config.batch_size,
          validation_data=(x_test, y_test),
          callbacks=[WandbCallback(data_type='image',
                                   training_data=(val_images, val_labels),
                                   labels=CLASS_NAMES)])
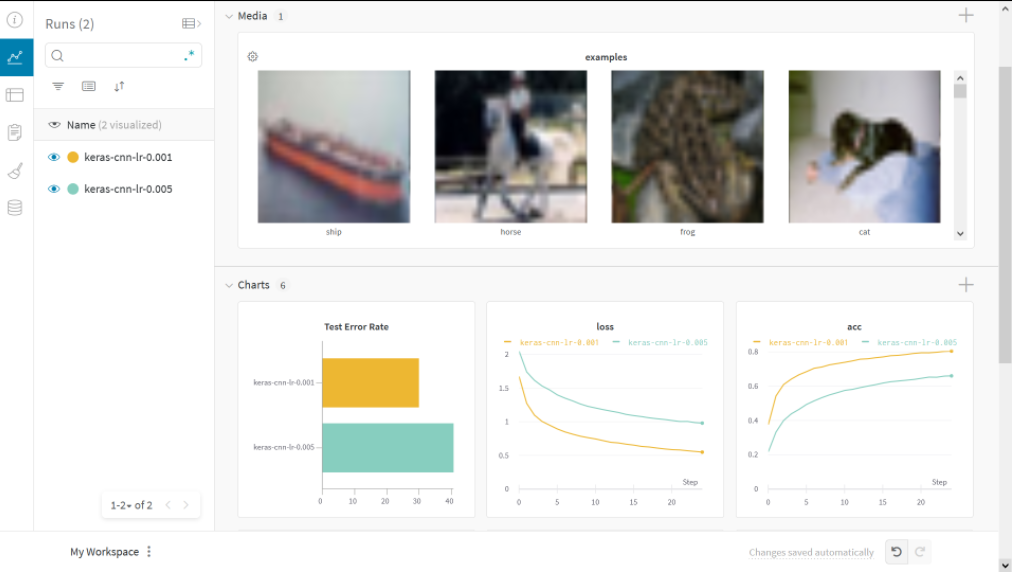
Log Custom metrics with wandb.log
You can always log custom metrics and extra information using wandb.log .
loss, accuracy = model.evaluate(x_test, y_test)
print('Test Error Rate: ', round((1-accuracy)*100, 2))

# notice the use of wandb.log.
# We can easiy pass in values as key-value pairs.
wandb.log({'Test Error Rate': round((1-accuracy)*100, 2)})
wandb Dashboard
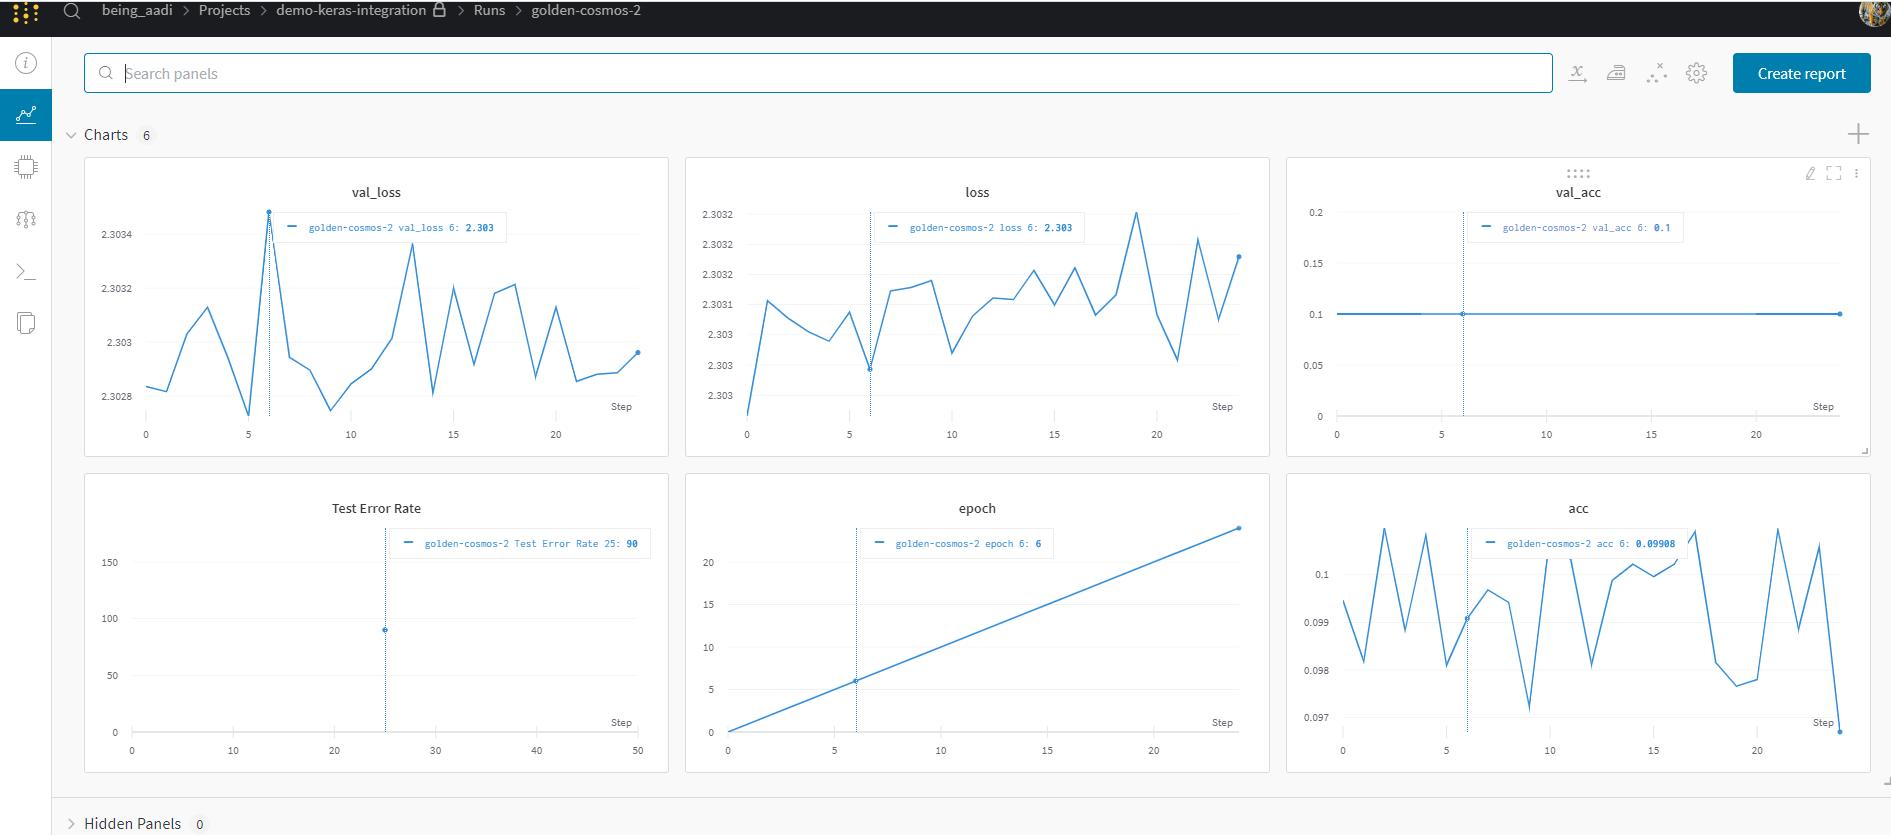
You can see all your logged metrics in your wandb project dashboard. Wandb Groups information into different sections like Overview, Charts ,logs, system, model and files.
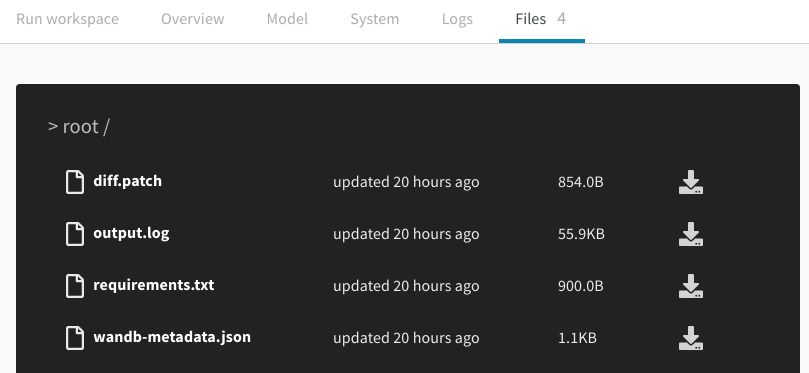
Overview
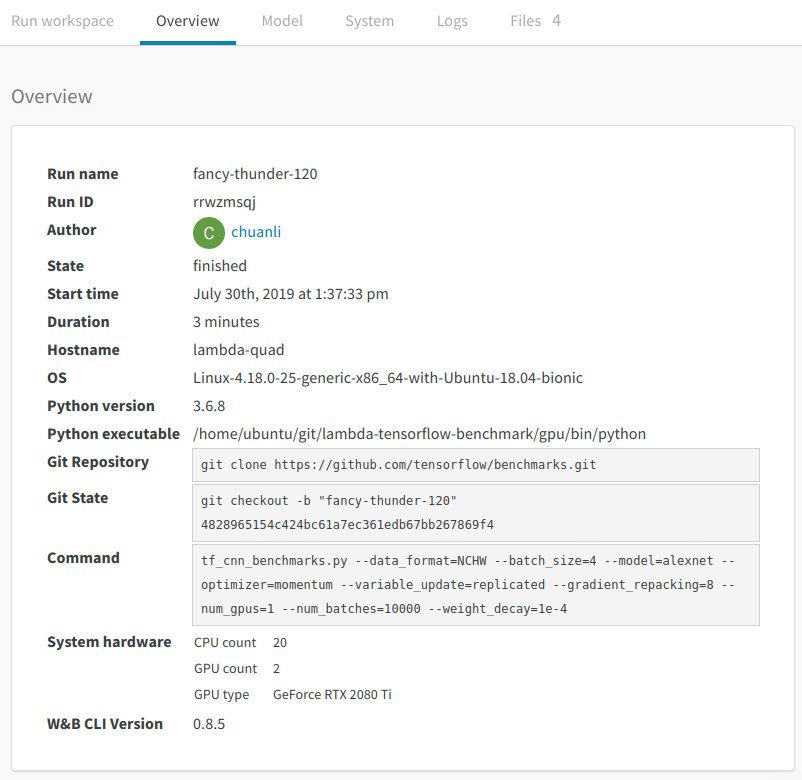
The information in the overview section is pretty intuitive and self-explanatory. However, the Git Repository field and the Git State field are worthy of special mention. You can run the checkout command in the Git State field to pin down the exact code for reproducing the experiment. Under the hood, wandb tracks all the changes you made to the original repo, and save the "diff" files in a local directory. In this way, you can easily switch between different versions of the code without manually pushing the change to the remote repo.
Logs
The logs section shows the console output during the experiment. This is useful for debugging the performance of the model.
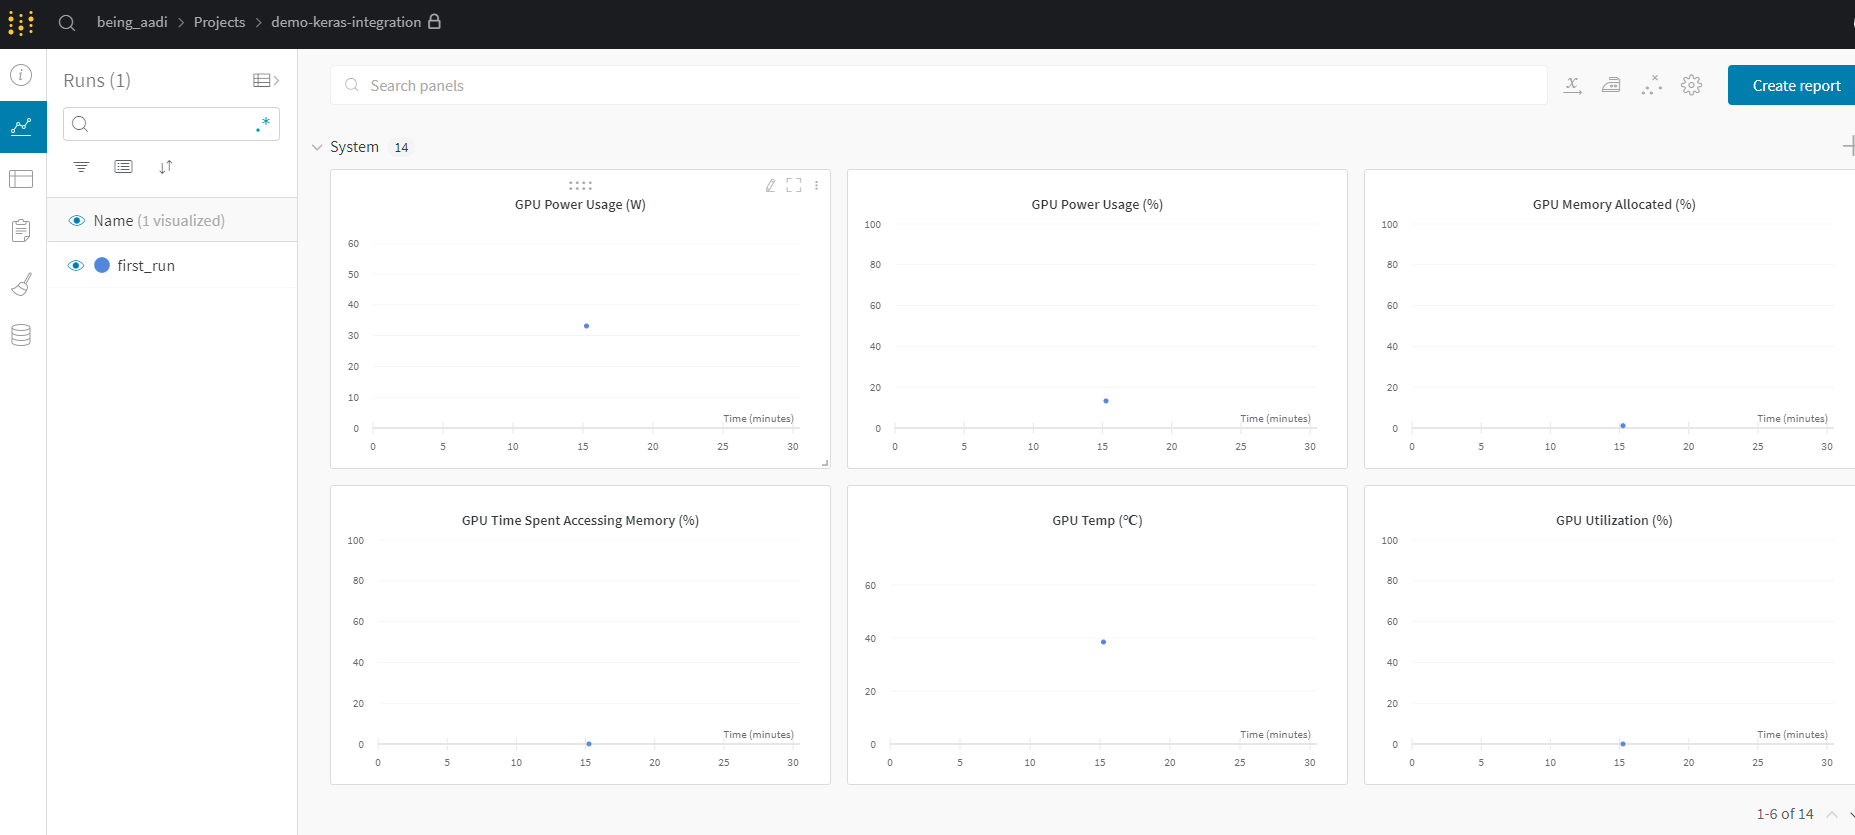
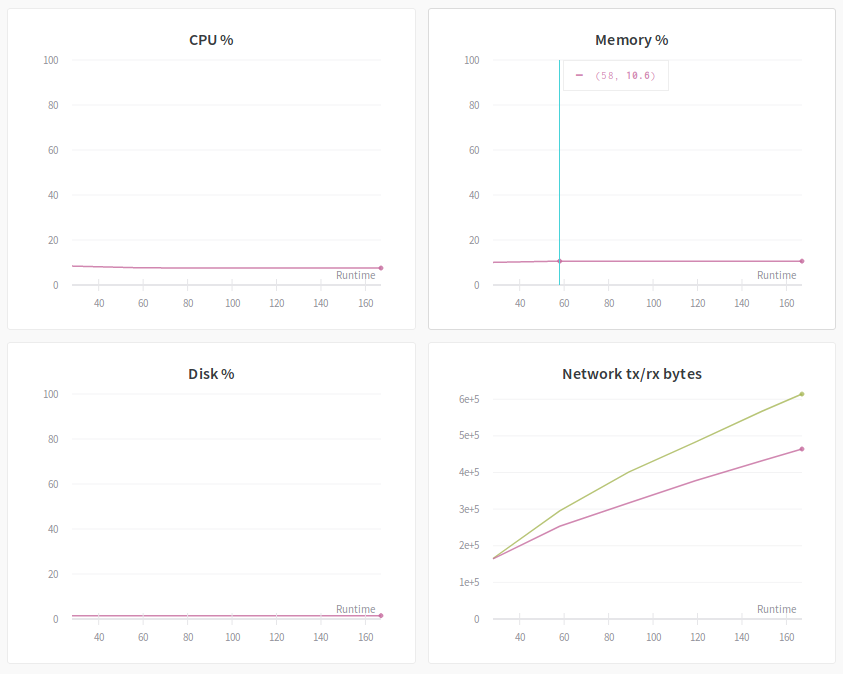
Systems
To me, the system section is where wandb really shines and separates itself from other options such as TensorBoard. It is a centralized place to track system utilization during the experiment. There are in total of 8 graphs displayed in this section. These graphs give you insight into the training bottleneck and possible ways to uplift it. For example, below are the diagrams of the experiment:
Tensorboard
wandb also provide options for people who love tensorboard. You can directly sync wandb with tensorboard by just setting sync_tensorboard = True in your wandb.init. So, that every information that is logged into tensorboard will also be logged into wandb.
wandb.init(
    name = '<your run name>',
    project = 'your project name',
    config = '<your config>',
    sync_tensorboard = True)
Summary
We discuss how to integrate wandb in any deeplearning framework using python for inspecting the efficiency of training jobs. We also looked into other aspects of wandb that makes it so much unique than other training logging software like tensorboard.
To learn more about wandb, check out their website: https://www.wandb.com/.